Data Story
Bars that grow, a hero number that counts up, and a source line you can trust.
16:9Medium pace7.5scleartrustworthyanalytical
Explainer style for metrics, reports and investor updates. A navy chart where bars grow in sequence and the insight bar glows teal, followed by a giant counting statistic with a one-sentence takeaway and its source.
Use this style
With Frame Jam installed, press Use this style in the local gallery, or just ask your agent:
Make a video with the Frame Jam style "data-story" and open it for review.Palette
background#0b1730
text#e8f1ff
highlight#2ee6c5
neutral#284066
muted#6f86ad
label#9fb4d6
Type
- Display
- Space Grotesk 700Titles 76px, hero stat 300px tracking -0.05em
- Body
- Space Grotesk 400, 500Labels 22–30px, takeaway 46px
Motion
- Bars
- expo.out
- Enter
- power3.out
- Counter
- power2.out
- Exit
- power2.in
- Average shot
- 3.7s
Bars grow 0.12s apart; dim the non-insight bars to 45% once the last one lands.
Transitions and text
- fade-up exit (y -30)
- scale-in for the hero number
- count-up via onUpdate (0 → value in 1.6s)
- value labels rise after their bar
- eyebrow slide from left
Style guide your agent follows
- One chart, one insight. Neutral bars are #284066; the insight bar is a teal gradient with a glow. Dim the rest to 45% after the reveal.
- Bars grow from the baseline with scaleY 0→1, expo.out, 0.9s, 0.12s stagger. Value labels follow 0.4s later.
- Hero numbers count up with a proxy object + onUpdate writing Math.round(value) into the DOM, 1.6s power2.out.
- Every statistic needs a one-sentence plain-language takeaway and a small source line (who, when, n=).
- Use real, specific numbers (e.g. 87%, 1,240 videos) — never round placeholders like 100%.
Similar styles
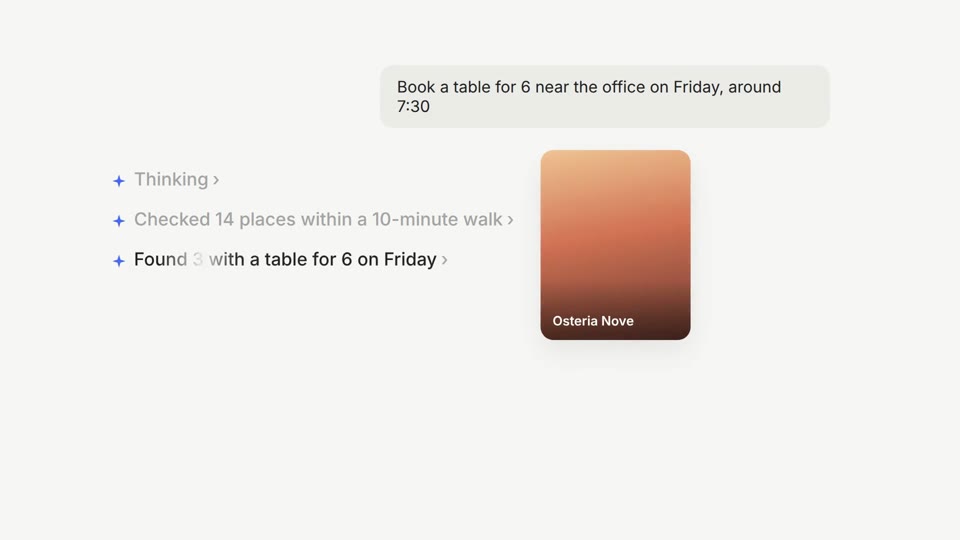 16:9 · Medium
Agent UI Demo
A glowing prompt bar, shimmering step-by-step agent status and a confirmation card that lands.
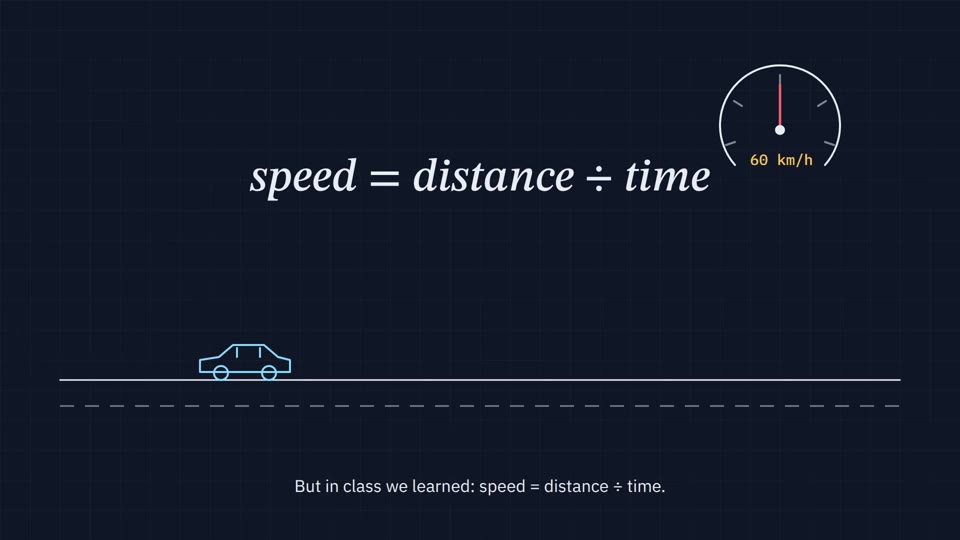 16:9 · Slow
Blueprint Explainer
Thin line drawings on a navy grid, a needle that sweeps, a formula that writes itself and calm subtitles.
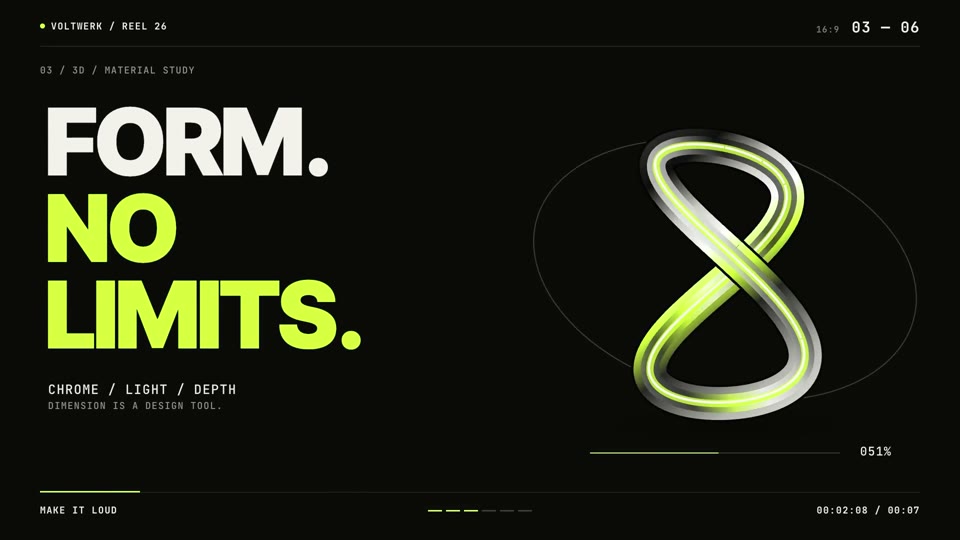 16:9 · Fast
Acid Chrome
Acid-lime brand reel: heavy all-caps statements, a spinning liquid-chrome knot and hard cuts on every beat.
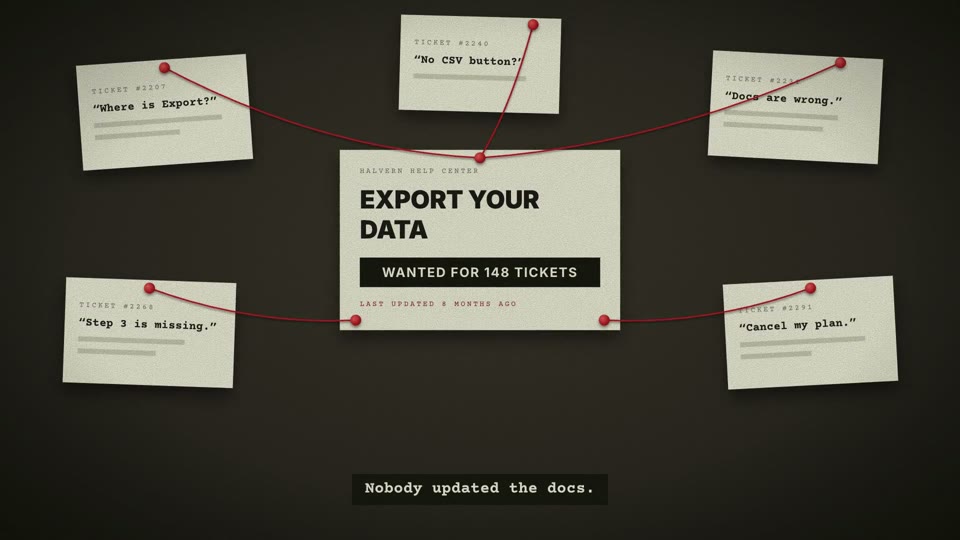 16:9 · Medium
Case File
A launch told as an investigation: typed case notes, redaction bars, red string on a corkboard and a stamp that closes the case.